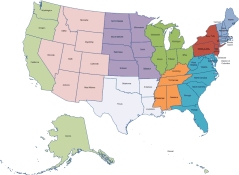
- Map of United States grouped by US Census Region
ShapeSource (www.ShapeSource.com) attracts thousands of visitors looking for Visio shapes and add-ons. What would you think is the most popular download? What type of shapes are requested most? The product downloaded most often is our free US Map stencil and we receive more requests for Visio map shapes than any other type of shape with the exception of network equipment.
To meet the demand for Visio map shapes we looked at several approaches. First we considered converting existing presentation quality vector image files into Visio. However, we found that the boundaries of several products we reviewed were not precise enough to meet our standards. They didn’t fit together all that well. They may be just fine for a PowerPoint presentation but we wanted to offer truly accurate map shapes. We accomplished our goal by converting data from Geographical Information Systems (GIS) such as ESRI shape files. We had already created a program for importing ESRI files into Microsoft MapPoint so we extended that technology to generate Visio map shapes from these super accurate data files. The result is MapShapes a series of Visio stencils containing shapes that accurately represent geography and offer several automation features. We also recognized that many users would like to use MapShapes in other applicatins like PowerPoint, Word, etc. so we include Enhanced Windows Metafile (.emf) vector images at no additional charge that you can easily insert into non-Visio documents.

Visio MapShapes regions fit together automatically
One of the key issues we addressed in the Visio stencils is the problem of fitting map segments together once you have disassembled them. There are several techniques that can return shapes to their original position. Ours is based on real relative coordinates of geographical regions as defined by the GIS data. When you drag a shape to a page, it locates itself on the page according at its relative position to other geography. If you move or resize the shape, you can right click to a menu that resets its original size and position. This eliminates any guess work. In the example shown, we dropped a Pacific, New England, South Central, and South Atlantic region shapes onto the page. They located themselves and subsequent additions will fit perfectly.
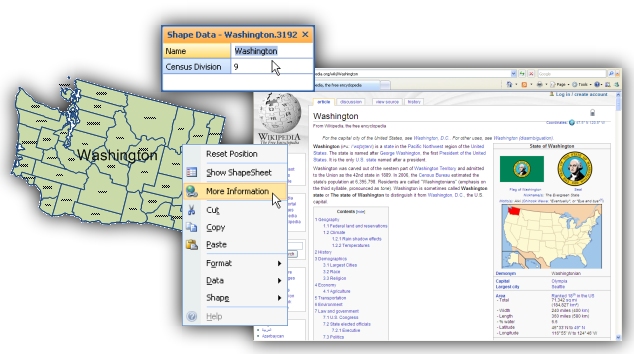
We also wanted our map shapes to enable easy access to the wealth of information available on the Web for geographical regions. Each MapShape contains a contextual link to the Wikipedia entry for the selected shape. From Wikipedia you can access a tremendous amount of additional information from links on its pages.

Visimation's MapShapes with ShapeLink to Wikipedia
In Visio 2007, MapShapes become even more powerful with Visio’s Data Linking features as shown below. Another VisioZone article describes where you can obtain free US Census Bureau data and use it with Data Linking to create useful and compelling data visualizations.

MapShapes linked to US Census data
Unlike clipart, MapShapes for Visio enable you to visualize data in Visio 2007. David Parker, a Microsoft Visio MVP, has developed a very nice Visio data model for the United Kingdom with maps he has created. MapShapes can visualize whatever data set you choose with Visio 2007. In another entry entitled Visio map shapes visualize demographic data in Visio 2007 we show how to use freely available US Census Data with MapShapes.
Chris Roth, aka Visio Guy, has drawn several maps with national boundaries that are useful and include an autopositioning feature similar to what we provide in MapShapes. There are several differences between these free sources and the MapShapes offered for sale on ShapeSource. GIS accuracy, attention to detail, automation features that make it easy to assemble maps and visualizations, the ability to extend their information reach well beyond Visio and out to the Web, pluse the vector .emf files we include at no extra charge. We have also released a MapShapes set for China that includes data for the province names in both English and Chinese characters.
© 2009 – 2010, Visimation. All rights reserved.
Using the various tools and add ins available at Visio toolbox website, you can certainly achieve this. Visio diagrams & new application design bring real-time data together from multiple sources.
It is a software which helps me a lot in all my activities and simplifies the process