 While it’s useful just to view geographic maps in Visio, the information becomes even more valuable when linked to data in Visio 2007. We’ll show you how to do this using Visimation MapShapes and you can use similar techniques to link data with any Visio 2007 diagram.
First, where do you find good data? Businesses that collect data about their operations or customers can link those data to Visio if they are stored in a structured data file like Excel, Access, SQL Server, or any other database application format. To illustrate the method, we’ll use data extracted from public records and placed into an Excel file. There is a wealth of free demographic data available for download from the US Census Bureau. The Download Center enables you to find data and then download it. Let’s show how this works with an example. Suppose we want to graphically illustrate the median household income by county for the state of Maryland.
The Census Bureau has data for 1999 that you can retrieve as follows:
- Go to the Download Center
- Click on Census 2000 Summary File 3 (SF 3) – Sample Data
- Select “All Counties” and then “Go”
- Scroll down to item P53 and highlight “Median Household Income in 1999 (Dollars)
- Click the “Add” button to add it to current table selections
- Click “Next” then “Start Download”
This will take a few minutes to gather the data and then you can download the zip file. Save it to a folder, extract the files, and then start Excel. I’ll give you the menu steps for Excel 2003… for Excel 2007 you can find the equivalent selections in the new “ribbon” interface but for this operation it will work similarly in both versions with a few exceptions.
- Select File>Open and navigate to the file “dc_dec_2000_sf3_u_data1.txt” that you just extracted
- In the Text Import Wizard, select “Delimited” then “Next”
- In the Delimeters section, check Other and then enter “|” by pressing Shift and the backslash “\” key
- Click Finish to import the data
- Expand the columns so you can see the headings
- This gives you all of the counties in the US sorted by state.
- Delete all of the rows that are not in Maryland and save the file as “Maryland – median income.xls”
- Delete the row for Baltimore City because it is not a county
- Delete the first row containing: GEO_ID, GEO_ID2, SUMLEVEL, GEO_NAME, P053001 (we don’t need this)
-
Finally, to match the county names in our drawing we must remove ” County, Maryland” from all of the entries. Select Edit>Replace and fill in the box as shown and then click “Replace All” (note that there is a blank space in front of County and that the “Replace with” field is left completely empty). This should leave only the text for the county name.

Changing the Excel data to synch with MapShapes
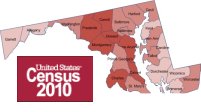
Save the file again… now we have data to link in Visio 2007. If you have the Visimation MapShapes of the US, you can drop Maryland on the page, then move and resize it as needed. Link the data by selecting Data>Link Data to Shapes. Follow the wizard to select the Excel file. Here’s what it will look like with the Maryland map shape:

Let’s link the data to the counties:
- In Visio 2007 select Data>Display Data on Shapes to open the Data Graphics window at the right
- At the bottom of the Data Graphics window, if “Apply after linking data to shapes” is checked, then uncheck it
- With the Maryland shape selected on the Visio page, right click in the External Data Window and select Automatically Link
- Check the radio button for Selected Shapes
-
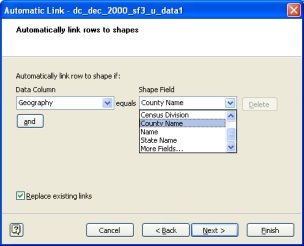
In the dialog, set the Data Column to “Geography” to equal the Shape Field “County Name” as below and click “Finish”.

Automatically link data to MapShapes in Visio 2007

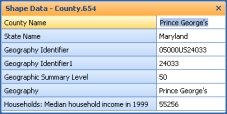
Visio Shape Data window
To color the map based on the data we’ll need a Visio 2007 Data Graphic. The MapShapes US Visio template already contains a Data Graphic that colors the regions and states according to their US Census Bureau ID number. We’re going to copy this and modify it to color the Maryland counties.
- In the Data Graphics window, click at the right side of the Data Graphic and select Duplicate to copy it
- In the copy, click at the right side and select Edit Data Graphic
- Under “Data Field”, click the pull-down menu and select “Households: Median household income in 1999”
- Click “Edit Item” and you will see that Visio has selected ranges based on the data set and assigned colors to each range; you can change these if you wish or click OK to accept
- Let’s also add an informative icon by selecting “New Item” and “Icon Set”
- In the Data Field, pick “Households: Median household income in 1999” once again and select the Callout as below:
Visio 2007 Data Graphics icons
- Select the Maryland shape and then Shape>Grouping>Ungroup. Although this will sever the state relationship, it provides access to the counties for data linking.
- Select all of the counties and click the new Data Graphic we just created to apply it to the selected shapes.

MapShape colored "by value" based on the linked data
This is just one example of the data visualization versatility of Visimation MapShapes when used with freely available data and Visio 2007’s Data Linking and Data Graphics features.
© 2009 – 2010, Visimation. All rights reserved.
Leave a Reply